Web Widget JSON Graph
![]()
![]()
![]()
![]()
![]()
This module allows to load a line graph per ordered pair from an One2many or Many2many field.
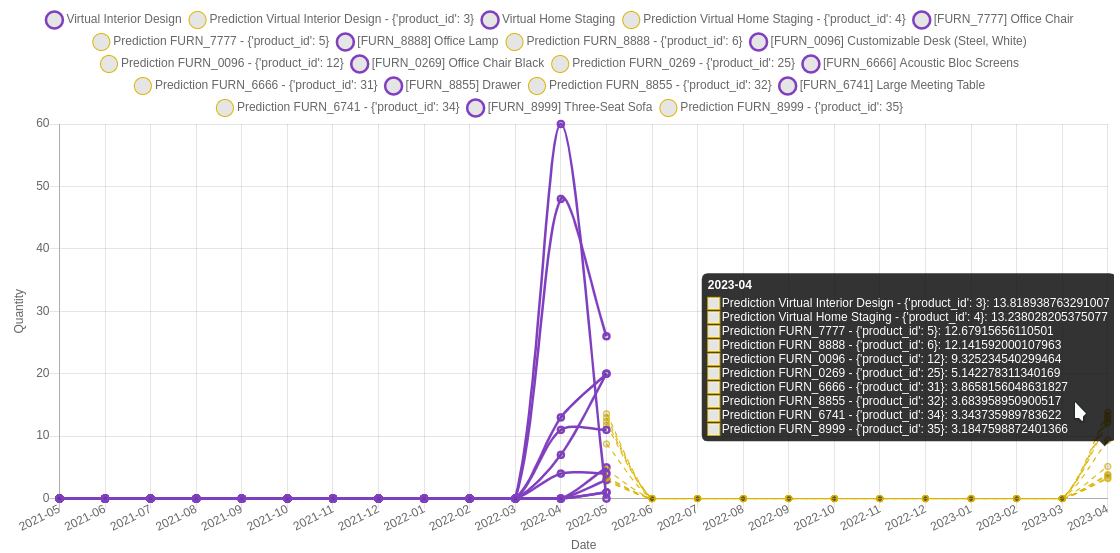
Table of contents
Usage
Use this widget by including:
<field name="field_text_json" widget="json_graph" />
For example:
<field name="values_data" widget="json_graph"/>
The JSON needs to be like:
info = {
    "type": "line",
    "data": {"datasets": [], "labels": []},
    "options": {
        "scales": {
            "yAxes": [
                {
                    "ticks": {"beginAtZero": True, "stacked": False},
                    "scaleLabel": {"display": True, "labelString": "Quantity"},
                }
            ],
            "xAxes": [
                {
                    "scaleLabel": {"display": True, "labelString": "Date"},
                }
            ],
        },
        "elements": {"point": {"radius": 3}},
        "legend": {"labels": {"usePointStyle": True}},
        "tooltips": {"intersect": False, "axis": "xy", "mode": "index"},
    },
}
self.field_text_json = json.dumps(info)
For example:
plot_dataset = [1, 2, 3, 4, 3, 2]
labels = ["Jan", "Feb", "Mar", "Apr", "May", "Jun"]
info = {
    "type": "line",
    "data": {"datasets": plot_dataset, "labels": labels},
    "options": {
        "scales": {
            "yAxes": [
                {
                    "ticks": {"beginAtZero": True, "stacked": False},
                    "scaleLabel": {"display": True, "labelString": "Quantity"},
                }
            ],
            "xAxes": [
                {
                    "scaleLabel": {"display": True, "labelString": "Date"},
                }
            ],
        },
        "elements": {"point": {"radius": 3}},
        "legend": {"labels": {"usePointStyle": True}},
        "tooltips": {"intersect": False, "axis": "xy", "mode": "index"},
    },
}
self.values_data = json.dumps(info)
For more information, please see Chart Js Documentation <https://www.chartjs.org/docs/2.9.4/>.
Bug Tracker
Bugs are tracked on GitHub Issues. In case of trouble, please check there if your issue has already been reported. If you spotted it first, help us to smash it by providing a detailed and welcomed feedback.
Do not contact contributors directly about support or help with technical issues.
Credits
Authors
- Vauxoo
Contributors
- Francisco Luna <[email protected]>
- José Robles <[email protected]>
- Luis González <[email protected]>
- Nhomar Hernández <[email protected]>
Other credits
Vauxoo
Maintainers
This module is maintained by the OCA.
OCA, or the Odoo Community Association, is a nonprofit organization whose mission is to support the collaborative development of Odoo features and promote its widespread use.
Current maintainers:


This module is part of the OCA/web project on GitHub.
You are welcome to contribute. To learn how please visit https://odoo-community.org/page/Contribute.